Impact of Ad Count on Conversion of Potential Customers to Buying Customers
A key part of any marketing campaign is understanding "when is too much?". In this case, the marketing team and product managers must understand the amount of ads or psas that are best to share with potential customers. In doing so, they will be able to send out the optimal amount of messaging to get the conversion rate which will yield the highest profits. The dataset contains information to answer that question, but first, we must understand a key piece of information regarding the distribution of ads/psas viewed by the participants of the expirement.

From the above distribution of ads/psas viewed, where the colors are the ranges of amount of ads/psas viewed by a given participant and the label is the conversion rate, it becomes clear quickly that most participants did not get shown a high number of ads or psas, as approximately 80% of people saw 150 or fewer ads. While people may not want to be bombarded with a high number of ads, it will be difficult to nearly impossible to break down ranges like 251 and above which contain so few people. As such, this page will focus on the ranges as shown in the pie chart and if the company wants to study and more granularly break down the effect of showing more than 250 ads/psas to each person, they must engage in additional data collection.
Once we have an understanding of the distribution of the amount of ads shown to each person, it is time to learn about the ideal ranges of ads and psas to place.

The above visualization displays the conversion rate for all people who were shown a specific number of ads. For example, the first bar represents the conversion rate (percentage of people who bought the product) amongst everyone who were shown 25 or fewer ads/psas. From the above visualization, the amount of ads/psas shown which leads to the highest conversion rates is not at the high or low end of the ranges. Rather, the ranges with the highest conversion rates are all between 101 and 175, with each having a conversion rate north of 17%. The single range that had the highest value at 17.70% was 101 to 125, suggesting that the marketing team should aim for each potential customer to view between 101 and 125 ads related to the product. While the visualization does not differentiate between the test groups, it does provide strong evidence of an optimal range of ads, in the absence of cost analysis.
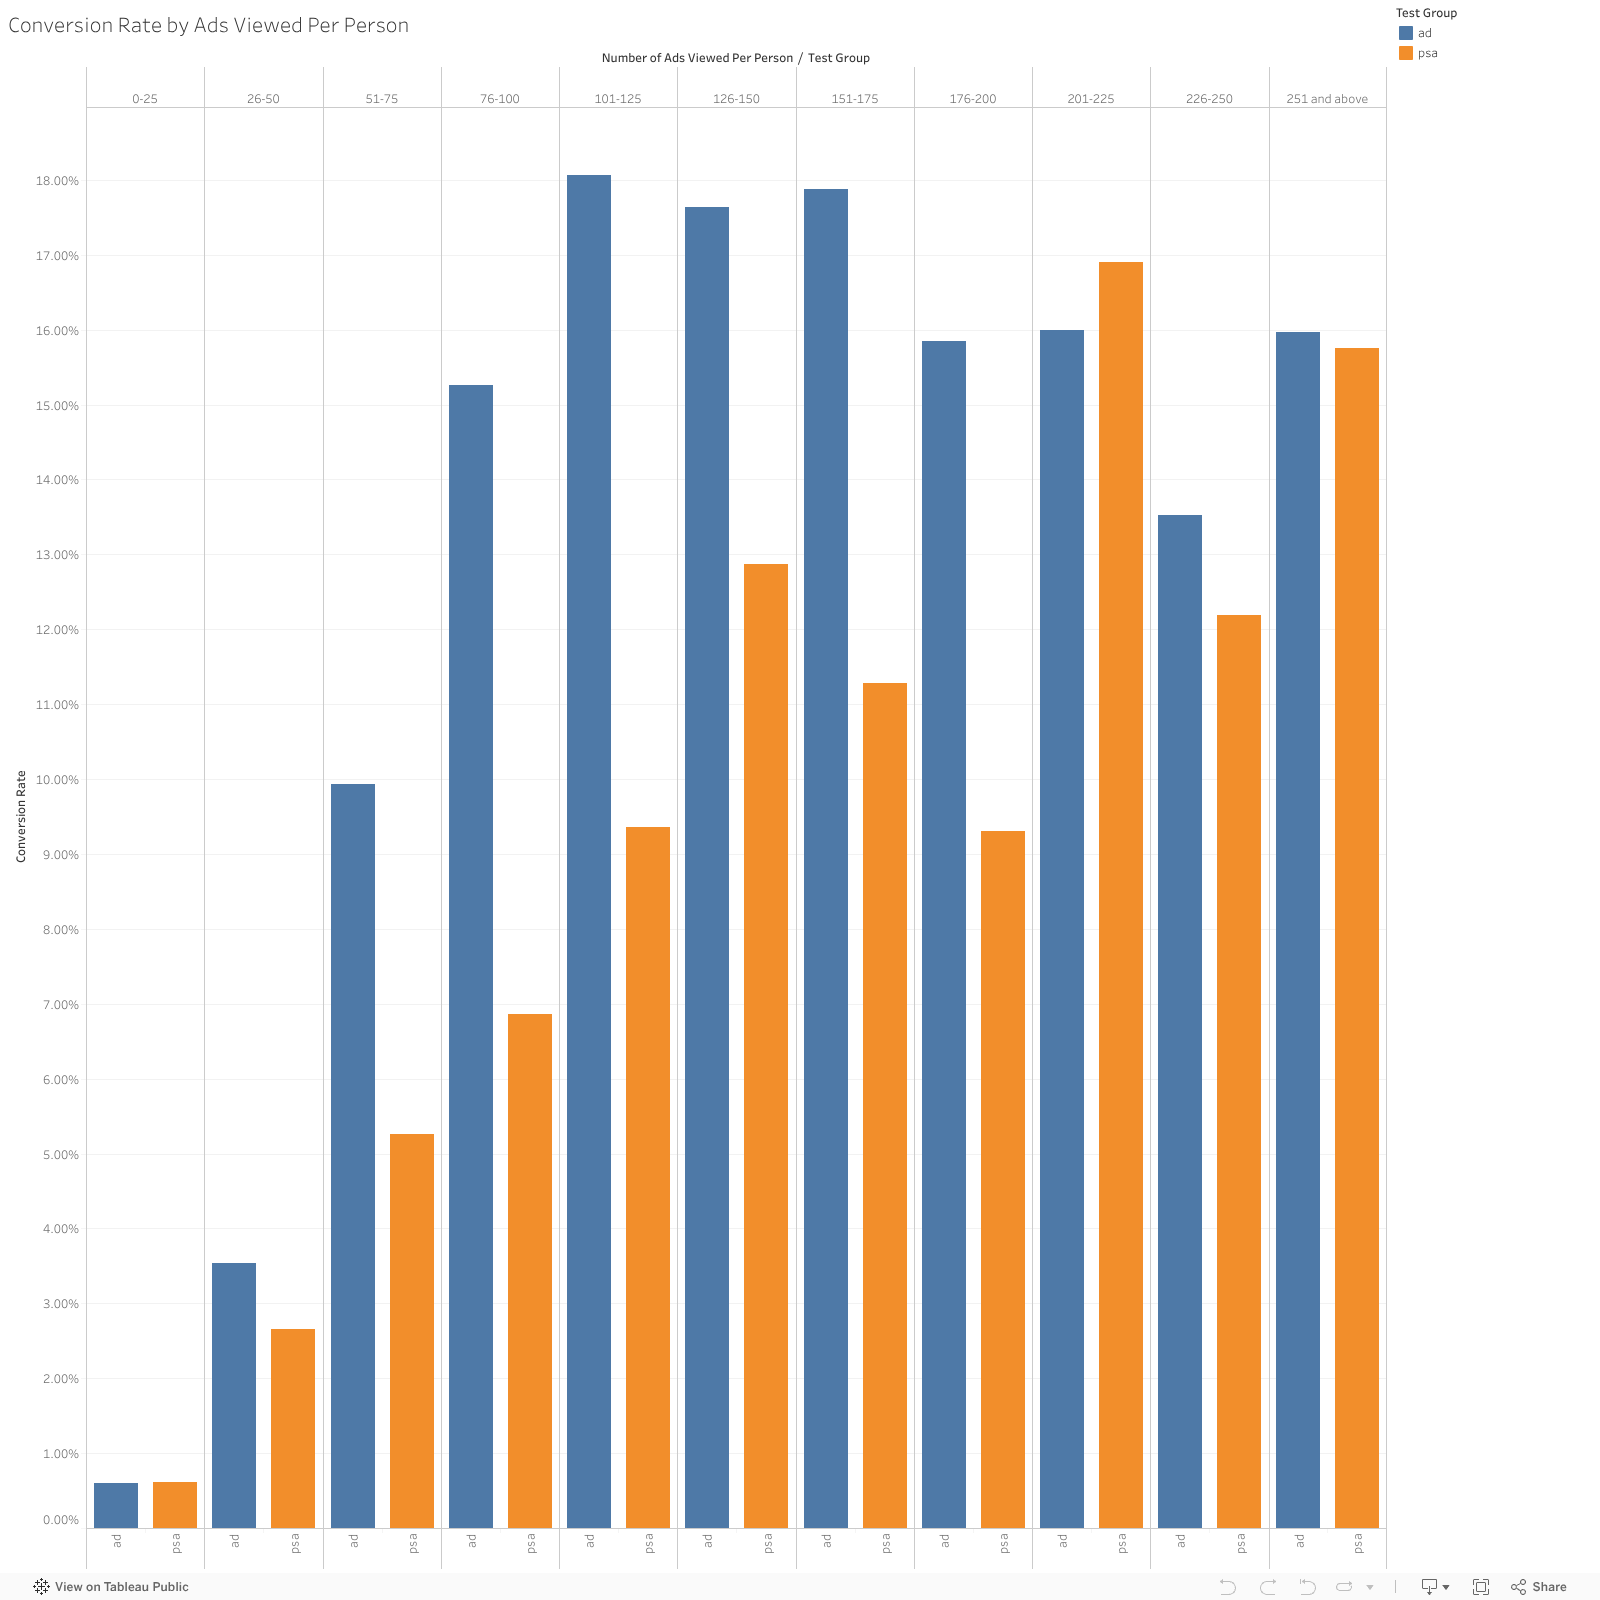
This visualization extends the previous one by separating between the test groups, ad and psa. From this, it is clear that the higher conversion rates of the ads group generally holds regardless of the amount of ads or psas shown, on average, to each participant. However, unlike the optimal number of ads viewed per person being between 101 and 125 ads, the optimal number of psas to show is actually between 201 and 225. The behavior of the visualization differs depending on the test group, but there does appear to be a clear optimal range for each test group, in the absence of a cost analysis.