Dashboards
Interactive visualizations using SF crime data from 2018 to present
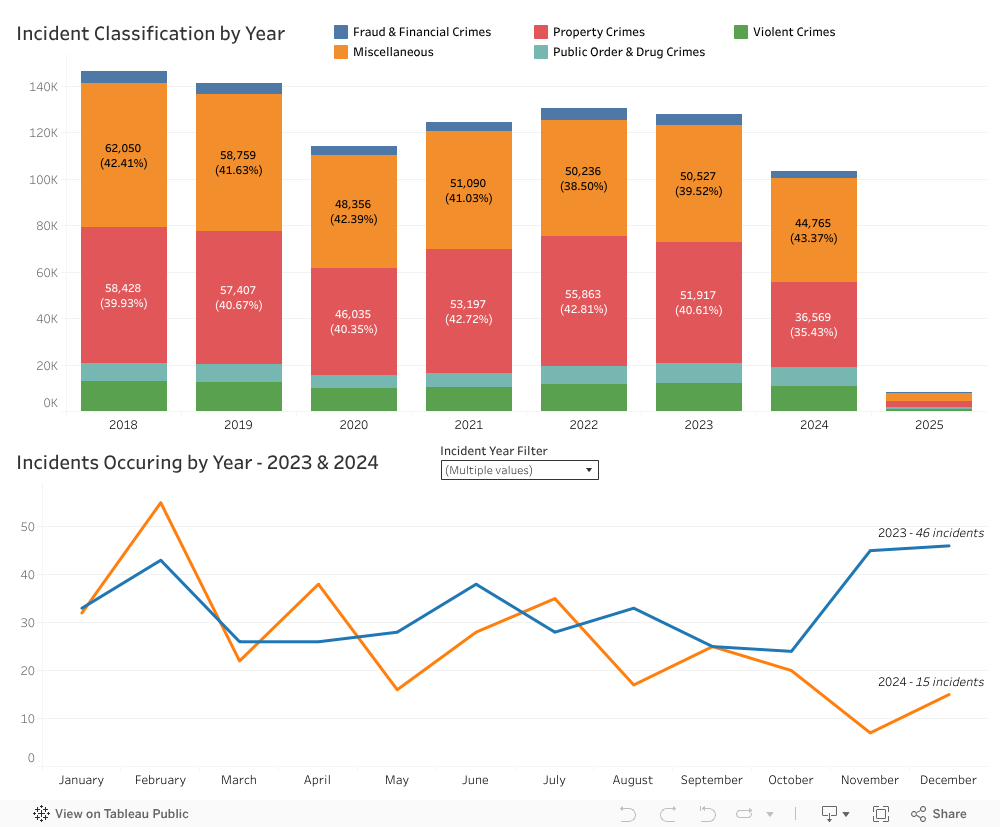
When do Incidents Occur
This part of the dashboard shows when crimes happen most often in San Francisco. The top chart shows the total number of crimes each year, and the line chart below shows how crime changes from month to month.
You can use the dropdown menu to choose which years you want to look at. Just keep in mind:
- Some filters only change certain charts — look for notes on the screen to help guide you.
- The top chart shows yearly totals for different types of crime.
- The bottom chart shows monthly trends, so you can see when crime goes up or down during the year.
If you move your mouse over the bars or lines, you’ll see more details, like how many incidents happened in a certain category or month.
If you select a year or group of years in the dropdown filter, make sure to click, “Apply”.
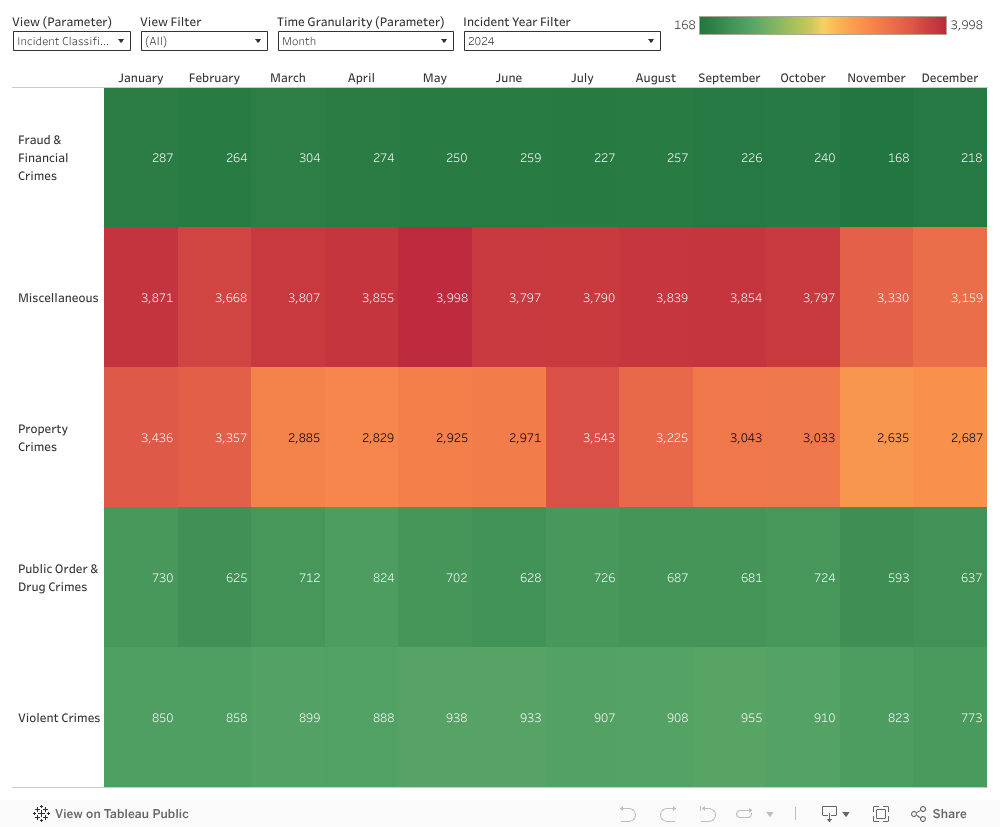
Incidents Occurrence Heatmap
This heatmap shows how often different types of crime happen in San Francisco during each month of the year. The darker the color, the more crimes occurred during that time.
You can use the filters above to focus on specific years, months, or crime types.
This view is helpful for spotting patterns, such as which months tend to have more property crimes or when violent crime increases. For example, darker red boxes mean higher crime activity. This can help communities and city leaders plan better crime prevention efforts.
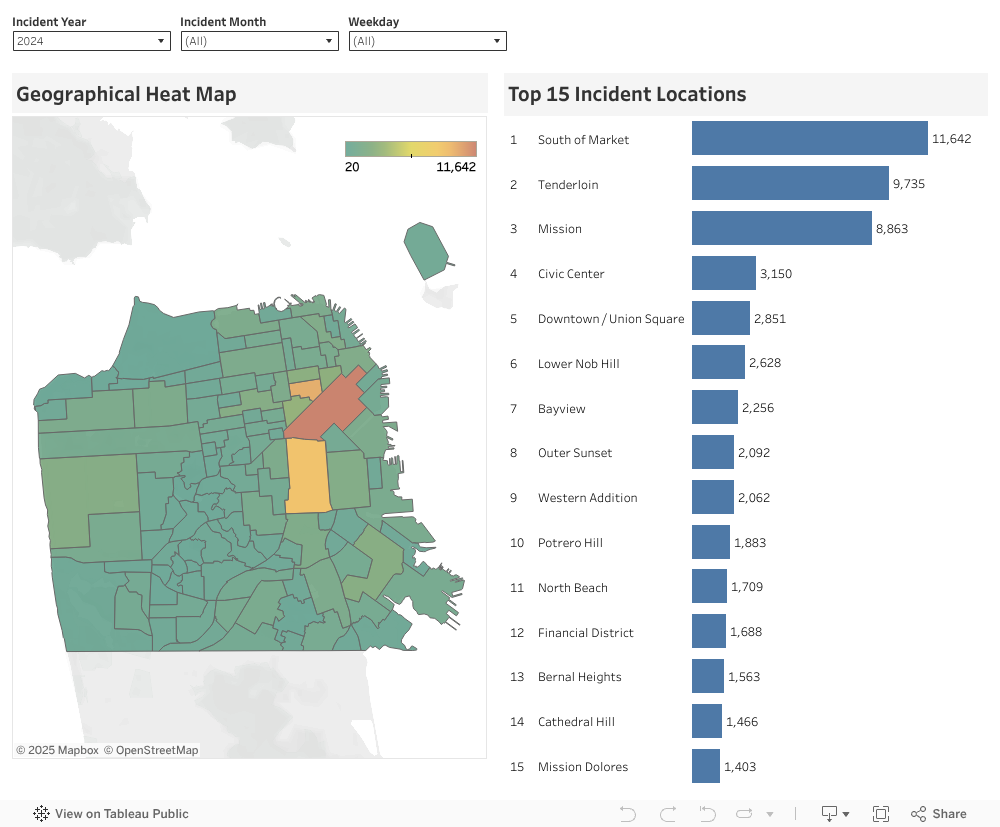
Geographic Crime Distribution
This map and ranking chart show where crimes are happening most often in San Francisco neighborhoods. The heatmap on the left uses color to show how many crimes occur in each area—darker colors mean more incidents. The bar chart on the right lists the top 15 neighborhoods with the highest number of reported crimes.
You can use the filters above to look at specific years, months, or days of the week. This helps identify when and where crime is happening most, so community leaders, city officials, and residents can focus on the areas that need the most attention.
Tip: After applying filters, please remember to click “Apply”. The heatmap and ranking will update to show trends for your selected time frame. Note that “All” years may take longer to load on some browsers due to the amount of data.
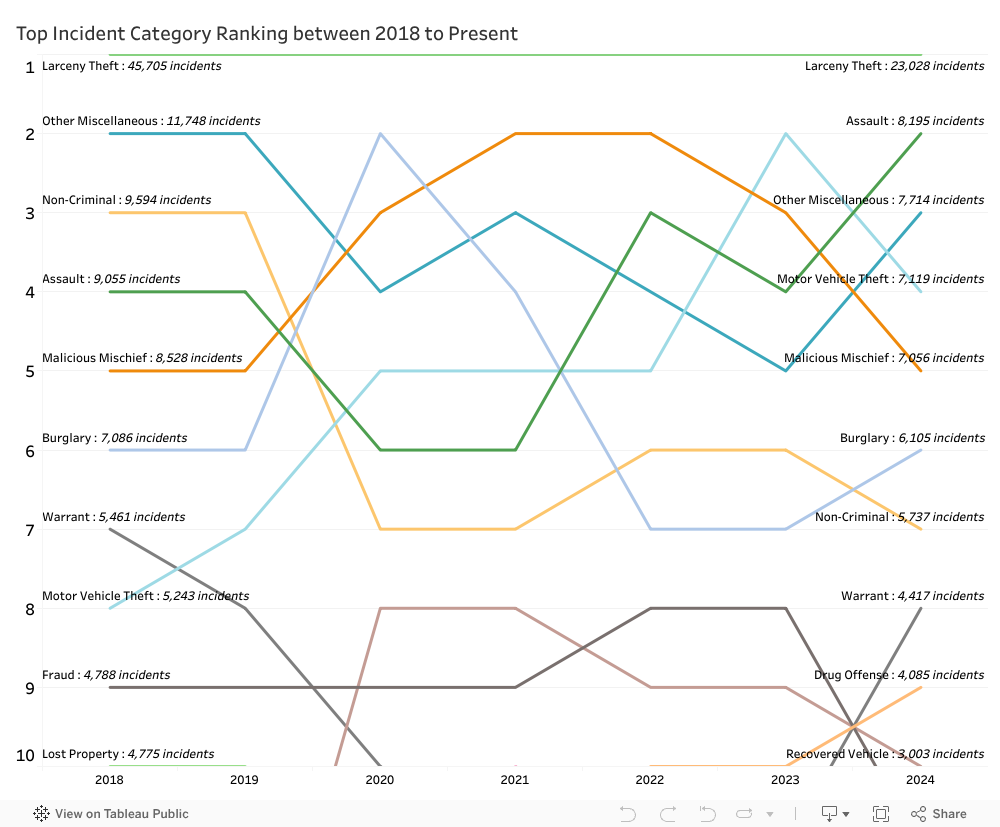
Crime Type Ranking
This chart shows how different types of crime have ranked in San Francisco from 2018 to now. Each line represents a crime category, showing how its rank (from most to least common) has changed over time. This helps you quickly see which crimes happen most often and how their frequency has shifted over the years. For example, larceny theft has remained one of the top reported crimes, while other categories have gone up or down in rank.
Tip: Hover over the lines to see how many incidents were reported for each crime type in a given year.
This chart shows rankings — not exact counts. For total numbers, refer to the "Incident Classification by Year" section.
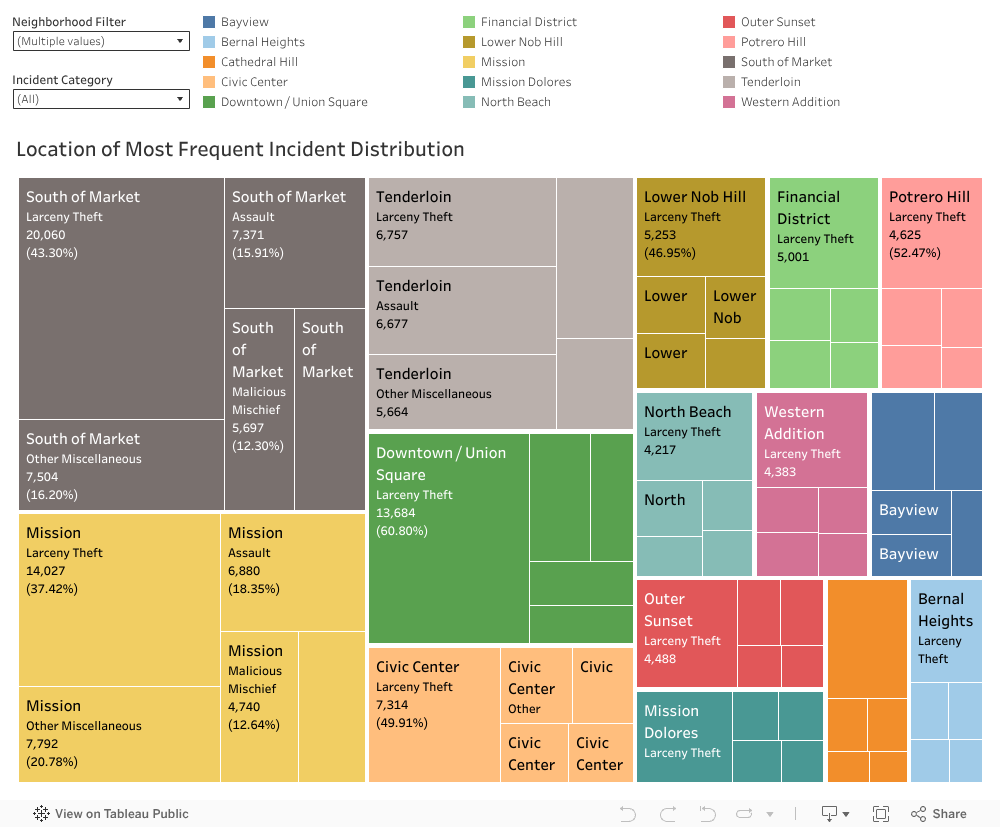
Crime Type TreeMap
This chart shows which types of crimes happen most often in different neighborhoods. Each box represents a specific crime category in a neighborhood. The bigger the box, the more often that crime occurred there. Colors represent different neighborhoods. Size shows how common each crime type is.
You can use the filters above to focus on certain neighborhoods or crime types. Please remember to select “Apply”. This view helps you quickly compare crime patterns across areas in San Francisco and see which neighborhoods deal with specific issues like theft, assault, or drug offenses. This view is useful for spotting dominant crime types in each area. It doesn't show crime rates or how they've changed over time.
Tip: Hover over a box to see the neighborhood, crime type, and number of incidents.